RESEARCH HIGHLIGHTS
Maximizing Savings from Energy Efficiency Programs
One goal of many low-income energy efficiency programs is to achieve maximum cost-effective energy savings. Evaluation research has shown that three important steps to reach this goal are to target homes that have high energy usage, install major measures where good opportunities exist, and ensure that effective, high-quality energy efficiency work is performed.
Selected Report: Barriers and Solutions to Achieving Potential Savings in Whole House Low-Income Weatherization Programs
Selected Presentation: Best Practices in Residential Energy Efficiency
Targeting High Users
APPRISE evaluation research shows that targeting and recruiting high usage program participants is critical to maximizing savings from energy efficiency programs. Below we show an example of electric baseload savings results and gas heating savings results that demonstrate this relationship.

Installing Major Measures
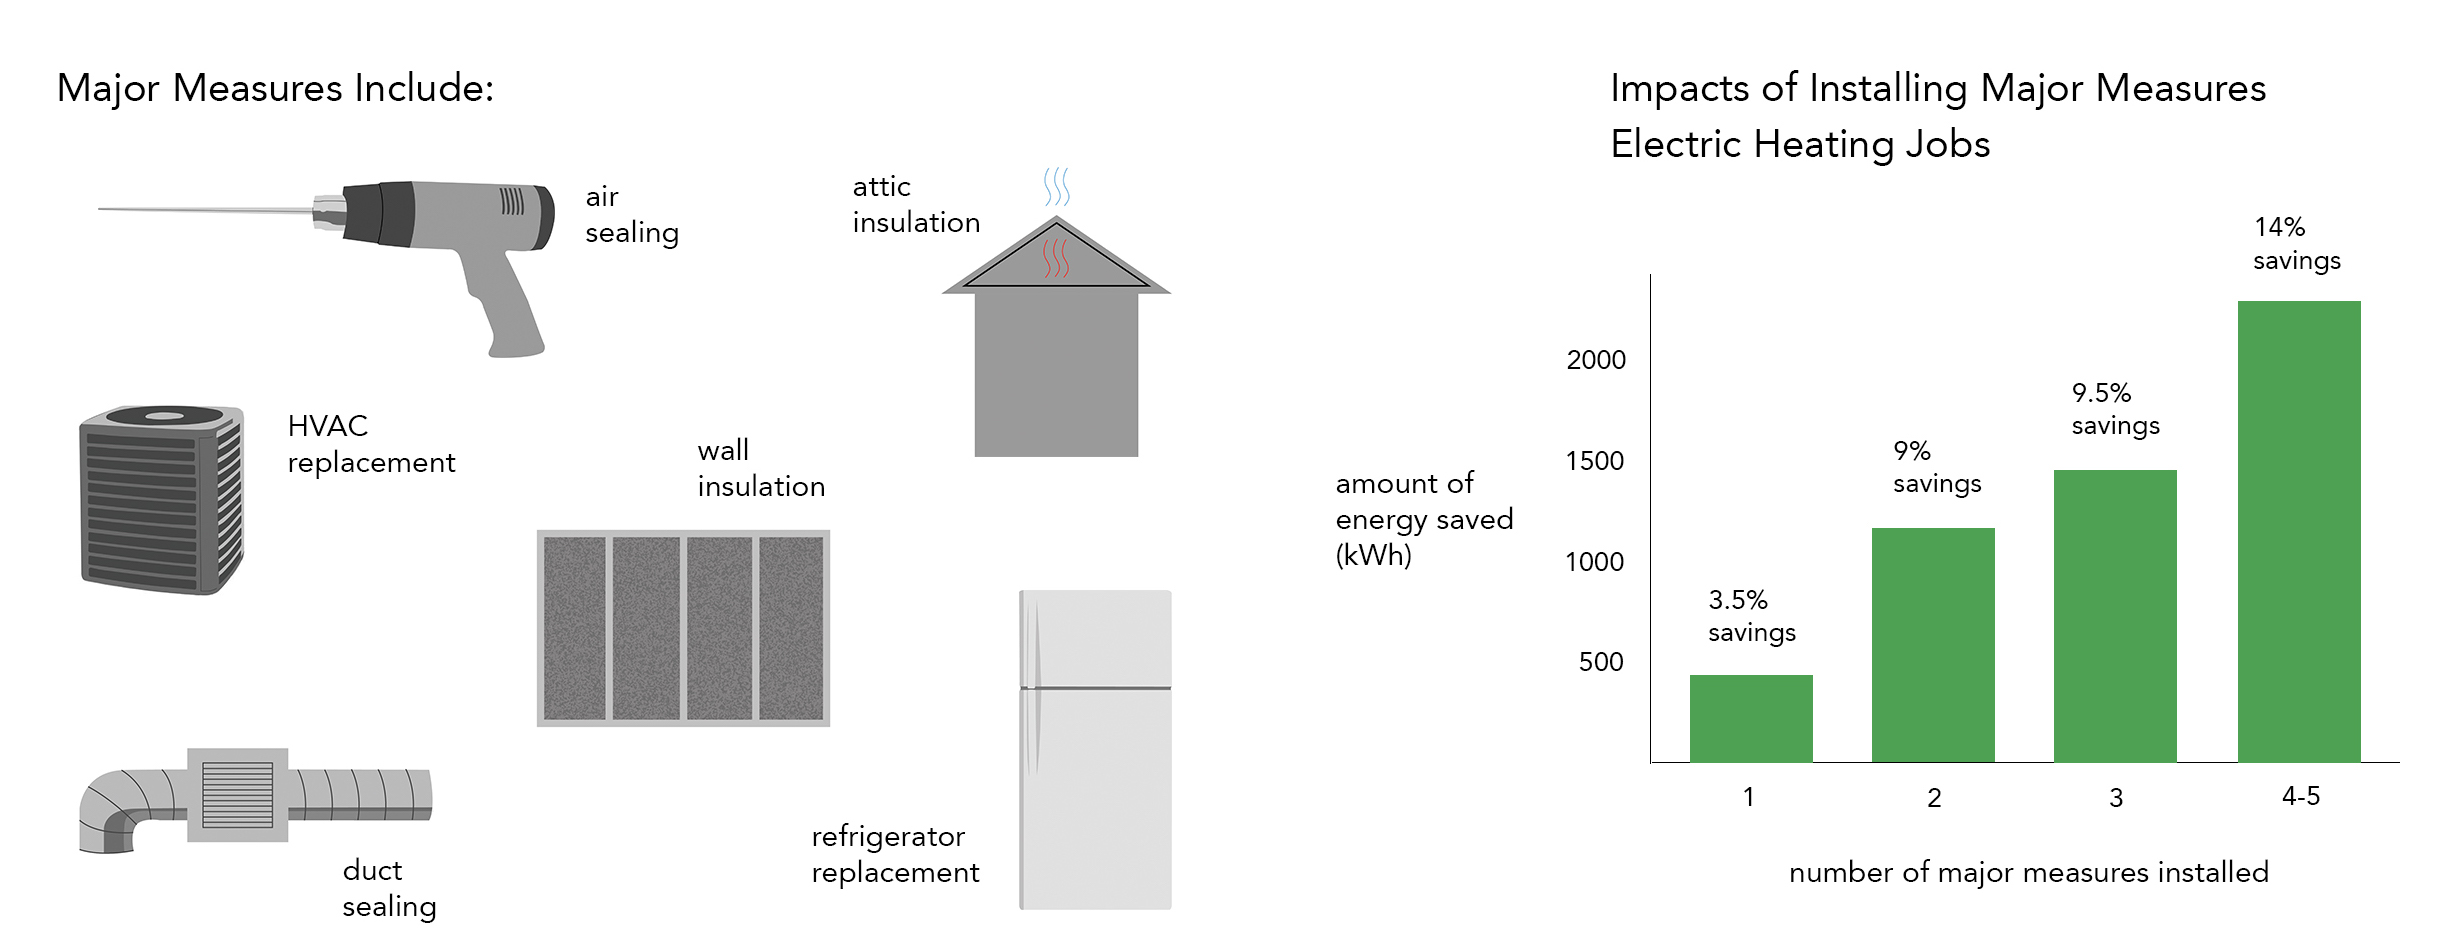
Health and safety issues and other challenges can result in a low penetration rate for major measures in some of the homes with the greatest opportunities for energy savings. These issues include mold and moisture, asbestos, and knob and tube wiring. Research on savings achieved by the number of major measures installed shows why it is critical to address problems that prevent important efficiency improvements.
Measuring Performance
On-site observation of service delivery and inspections of completed work in low-income programs around the country have found that installations often do not follow best practices identified and demonstrated in the building science field {through prominent weatherization experts and organizations such as the Building Performance Institute (BPI)}. Additional documentation of procedures, contractor training, and quality control can help to increase the use of best practices in energy efficiency programs. Examples below show results from extensive on-site observations and best practices that are more and less commonly observed.

Non-Energy Impacts from Energy Efficiency Programs
Energy efficiency programs lead to substantial benefits beyond the energy and demand savings they achieve. These Non-Energy Impacts (NEIs) are important to understand and measure to accurately assess cost-effectiveness and effectively market the program to potential participants.
Selected Report: Non-Energy Benefits of WAP Estimated with the Client Longitudinal Survey – Results Report
Selected Presentation: Analysis of Non-Energy Impact Calculations
Health and Safety
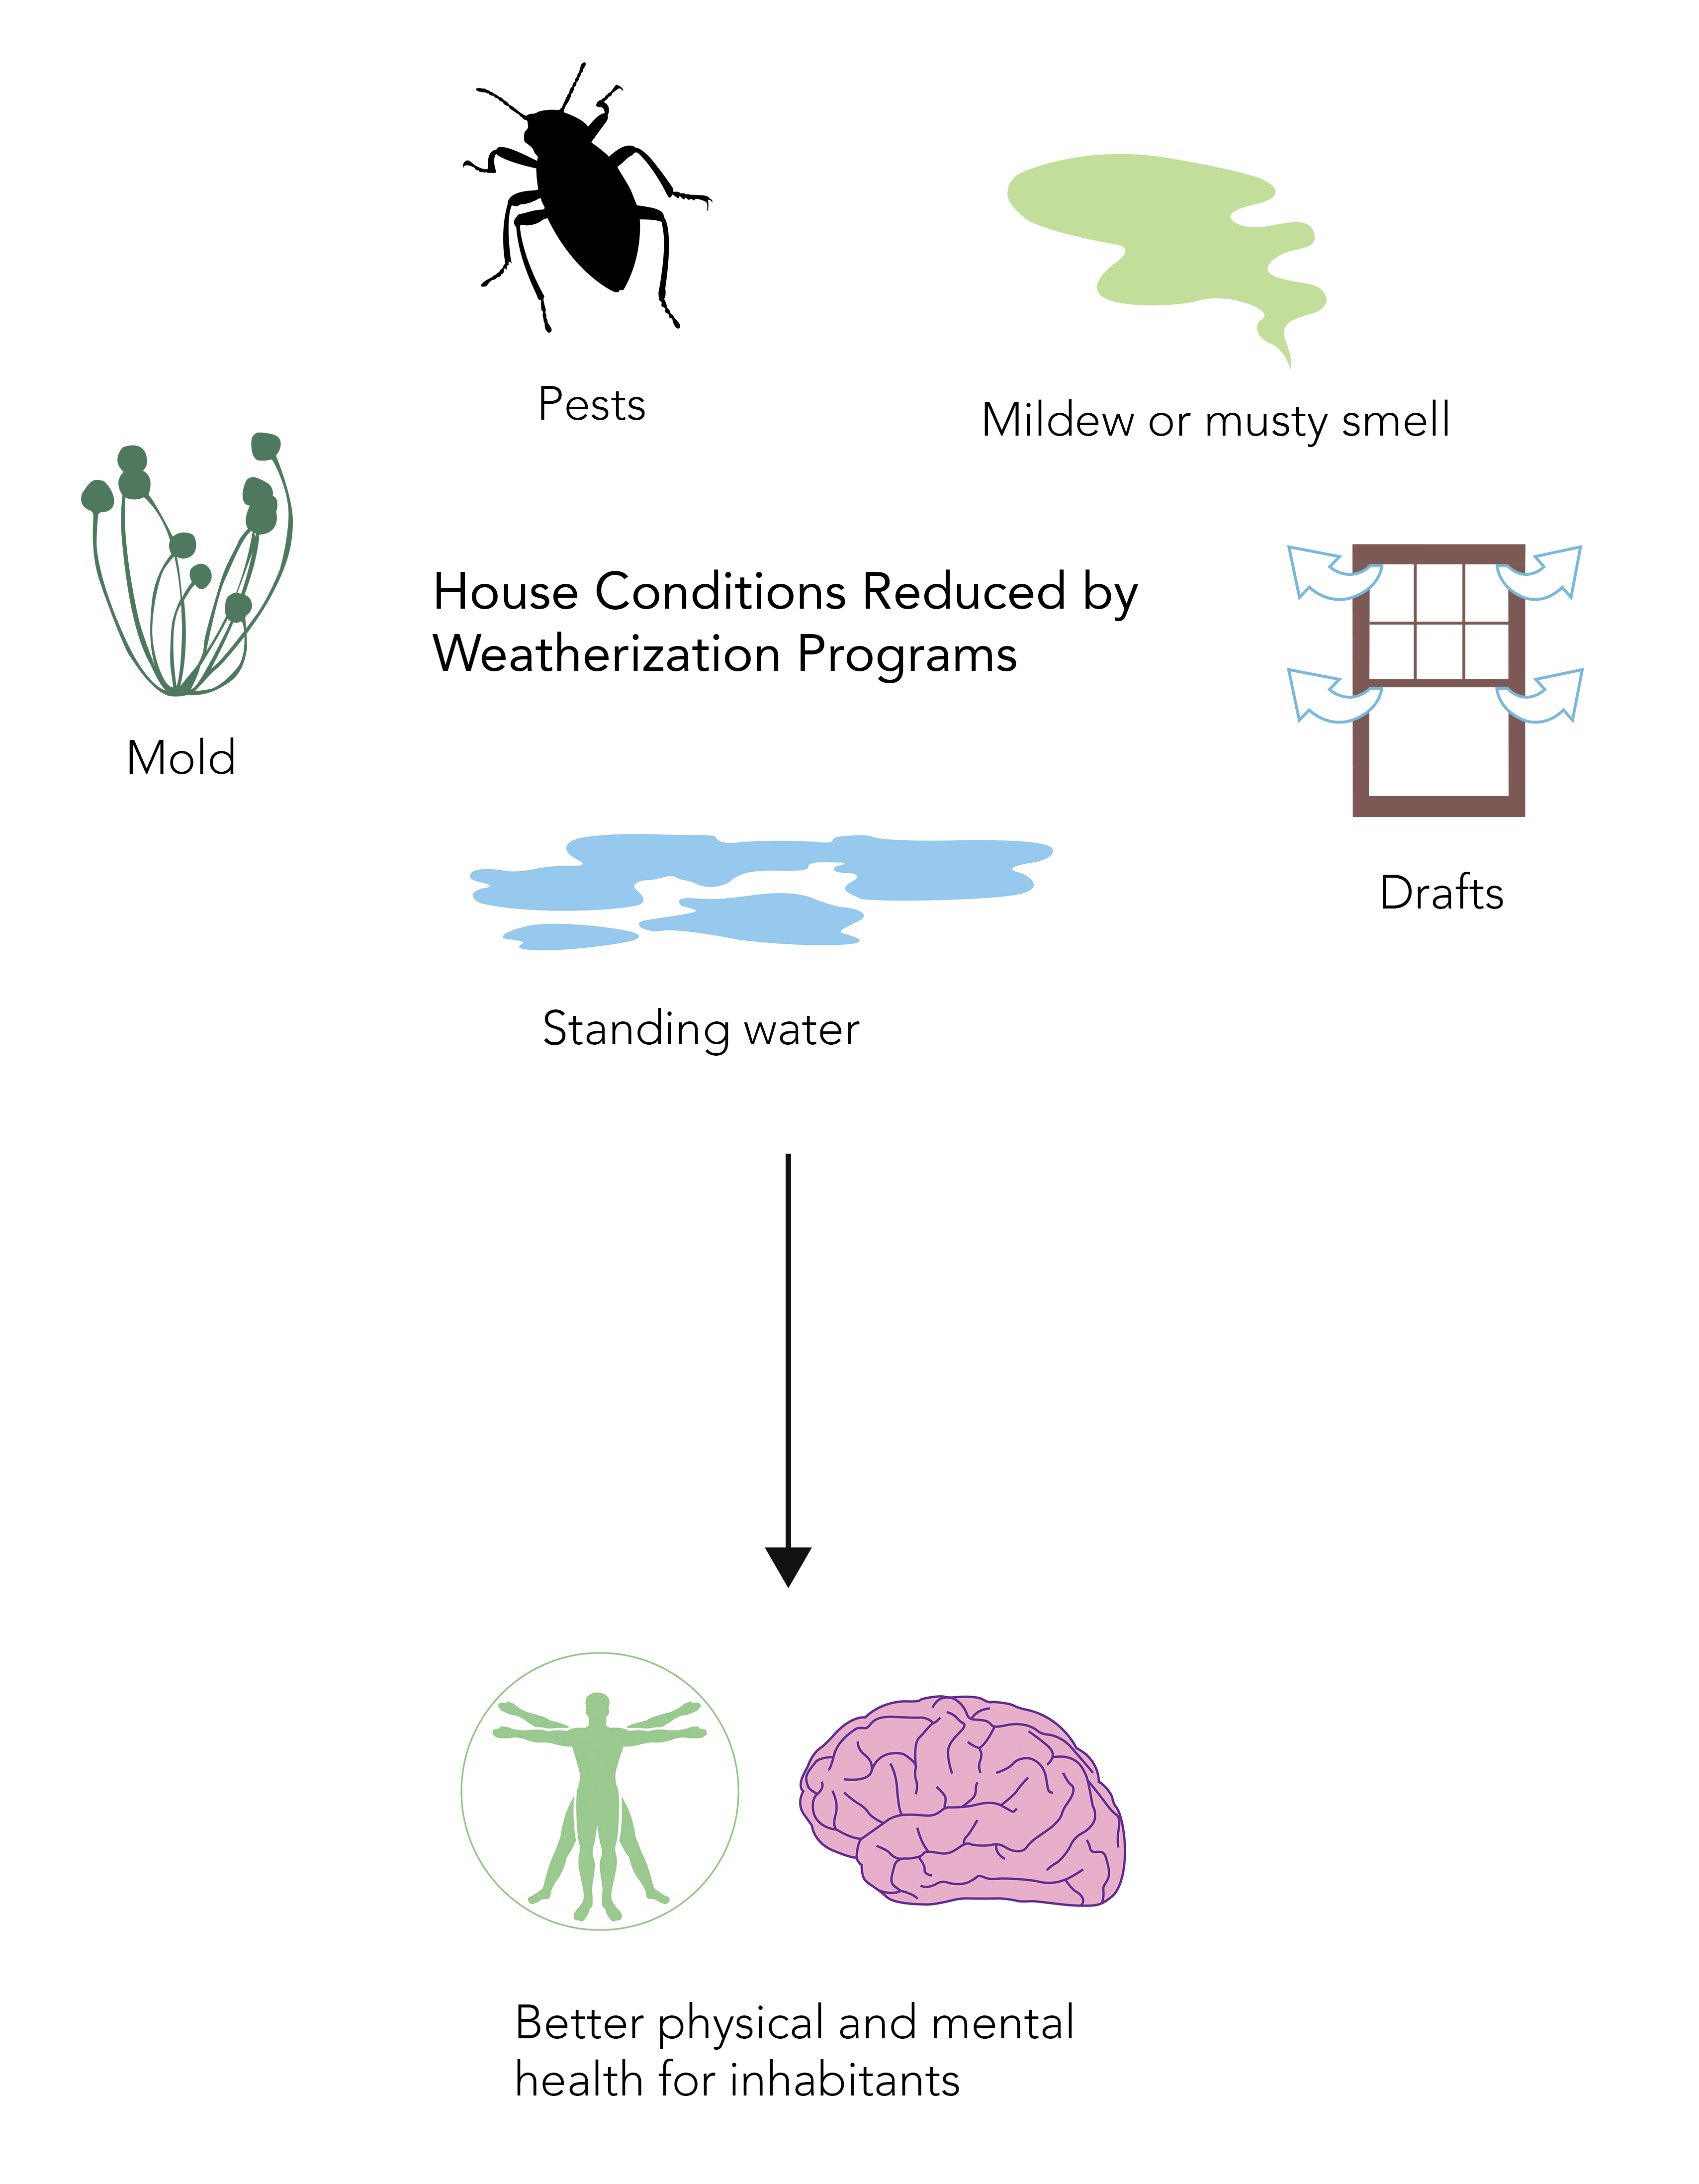
Energy efficiency work can have significant impacts on home safety by checking for and potentially addressing problems including carbon monoxide issues, gas leaks, mold and moisture issues, depressurization or drafting issues, asbestos, bath or dryer venting issues, and structural issues. A recent study APPRISE conducted in New Jersey found that 40 percent of customers who participated in a high-efficiency furnace/boiler replacement program had at least one of these issues at the post-inspection visit.
Addressing the home safety issues and housing and comfort issues may impact occupant health, including presence and severity of asthma symptoms. However, serious carbon monoxide issues are relatively rare and impacts of weatherization on health may only be experienced by those sensitive to indoor pollutants or uncomfortable temperatures. Therefore, these NEIs, impacting a small percentage of participants, can be difficult to measure in the data.
Home Comfort
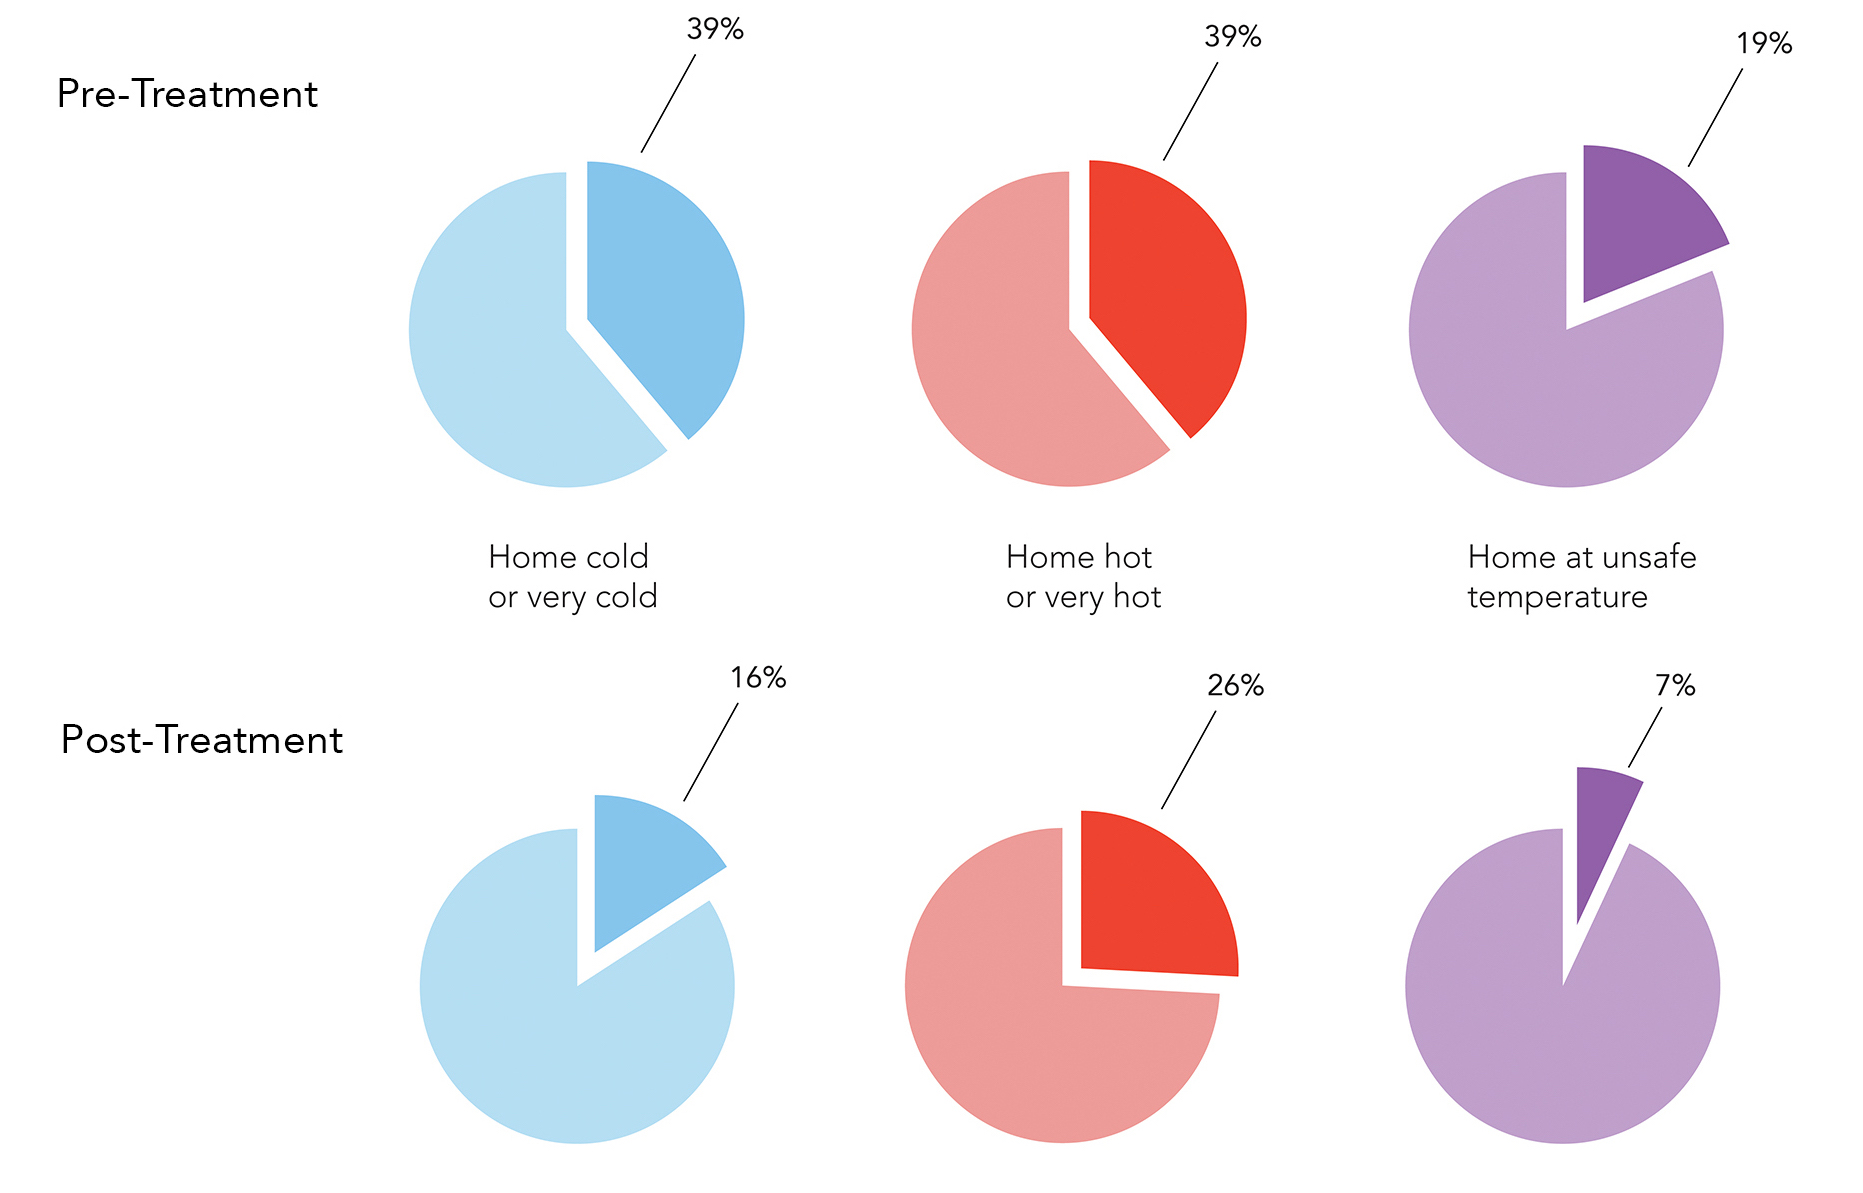
Energy efficiency services can impact housing conditions and home comfort including presence of insects or pests, indoor noise levels, draftiness, indoor temperature comfort, and unsafe indoor temperatures. To the right we show one example of the impact of a low-income energy efficiency program on the comfort of the home temperature.
Another study of a Home Performance with Energy Star program asked participants an open-ended question about changes they noticed in their home since the energy efficiency work. A significant percentage of customers reported non-energy impacts.

Affordability
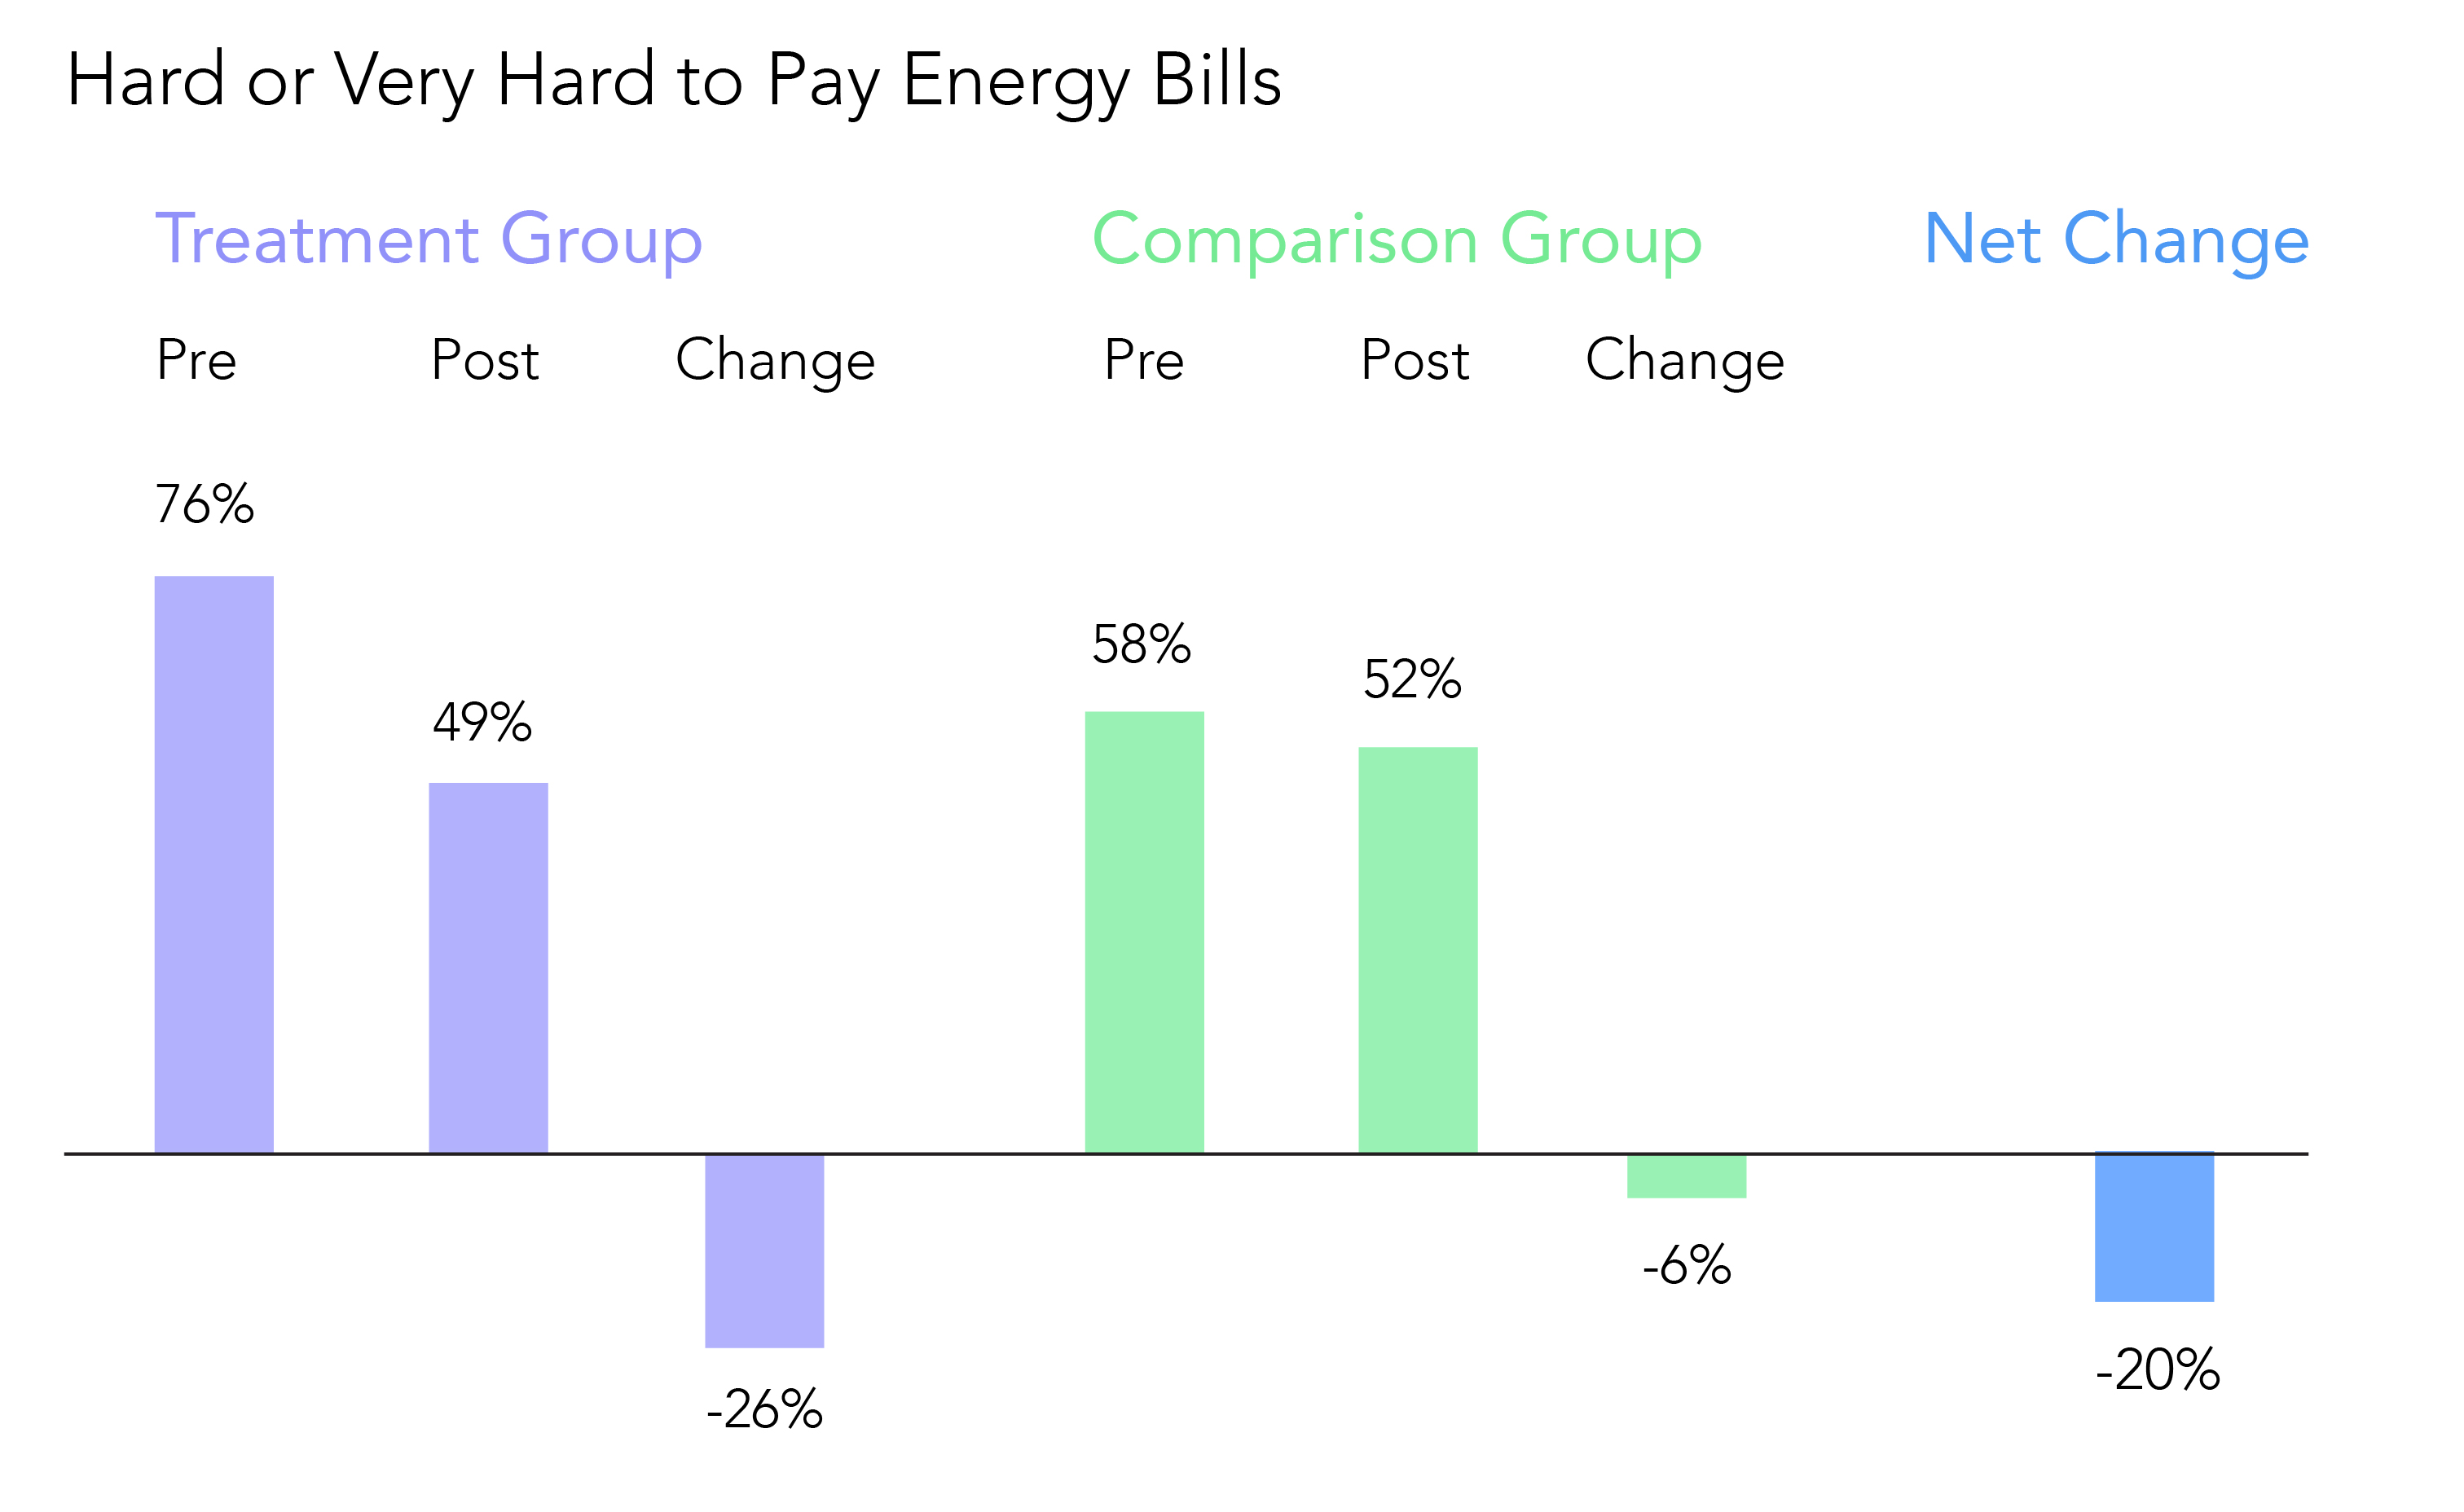
Energy efficiency services and programs reduce energy usage and reduce energy bills for the average participant household. As a result, energy bills should be more affordable, and participants may be more able to meet their energy and other needs. These impacts will be important for the lower income participants, and especially for those at the margin of being able to afford their bills.
Below we show an example of pre- and post-treatment energy affordability problems among low-income energy efficiency program participants and an earlier participant comparison group.
Economic
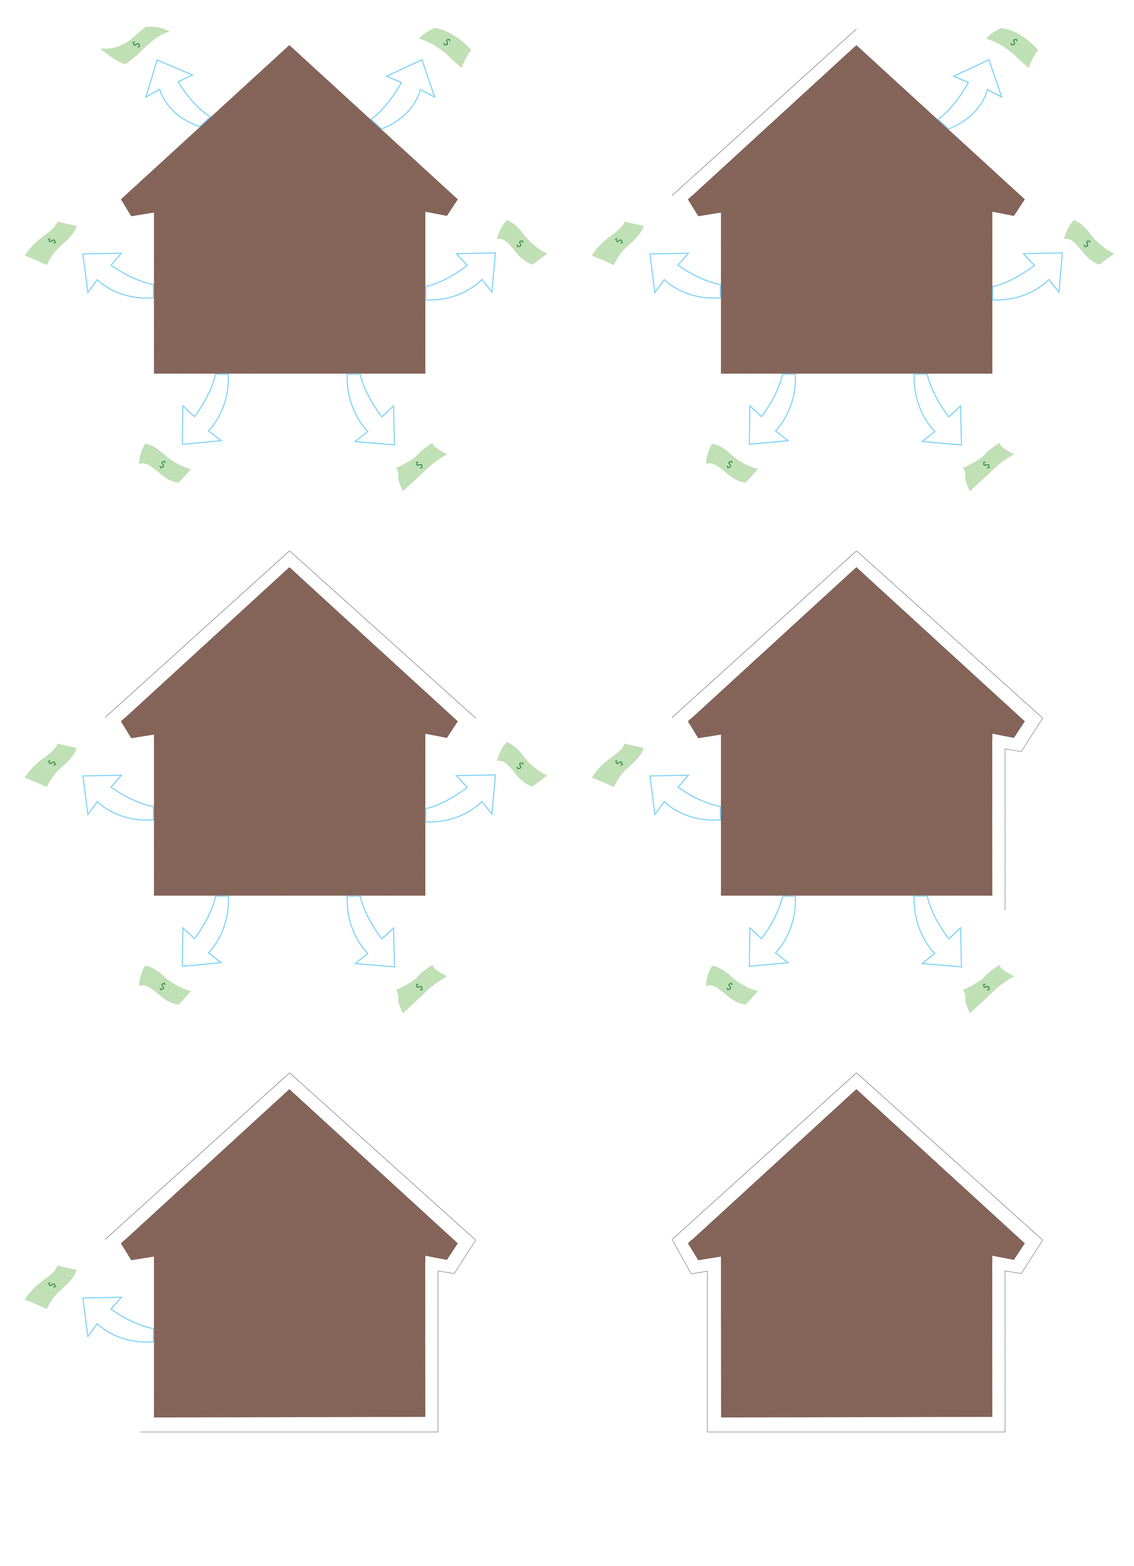
Energy efficiency programs result in economic benefits because they shift expenditures from those industries that have lower economic multipliers to industries that have higher multipliers. Two key expenditure shifts typically occur as a result of these programs.
– Energy efficiency expenditures replace general retail expenditures
– Retail expenditures replace electric and natural gas (and other fuel) expenditures
These differences result from the labor-intensity of each industry and the percentage of expenditures that are locally made.
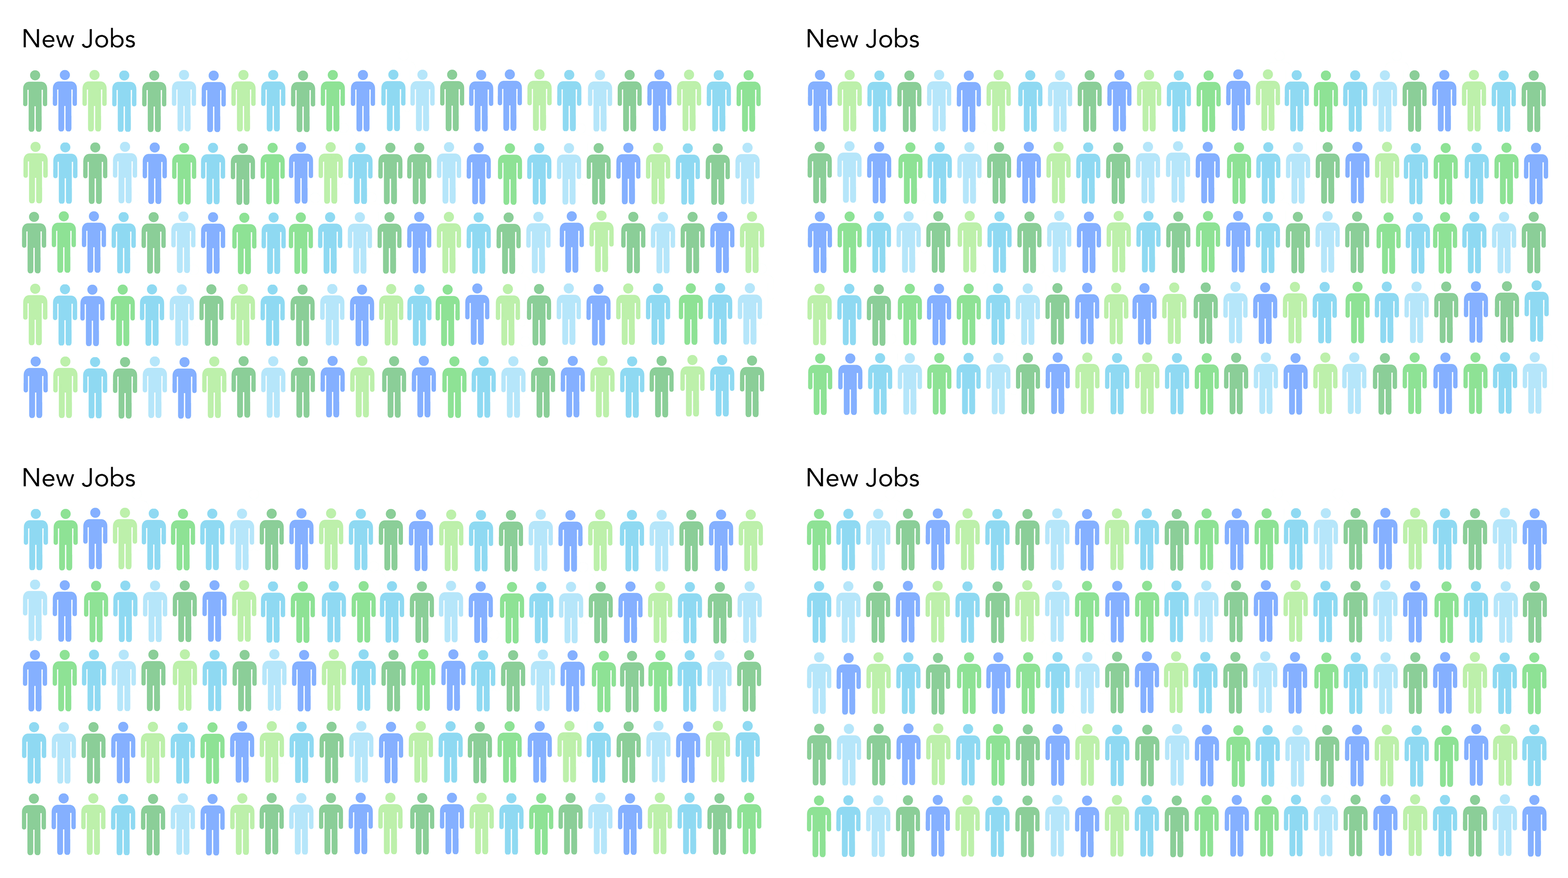
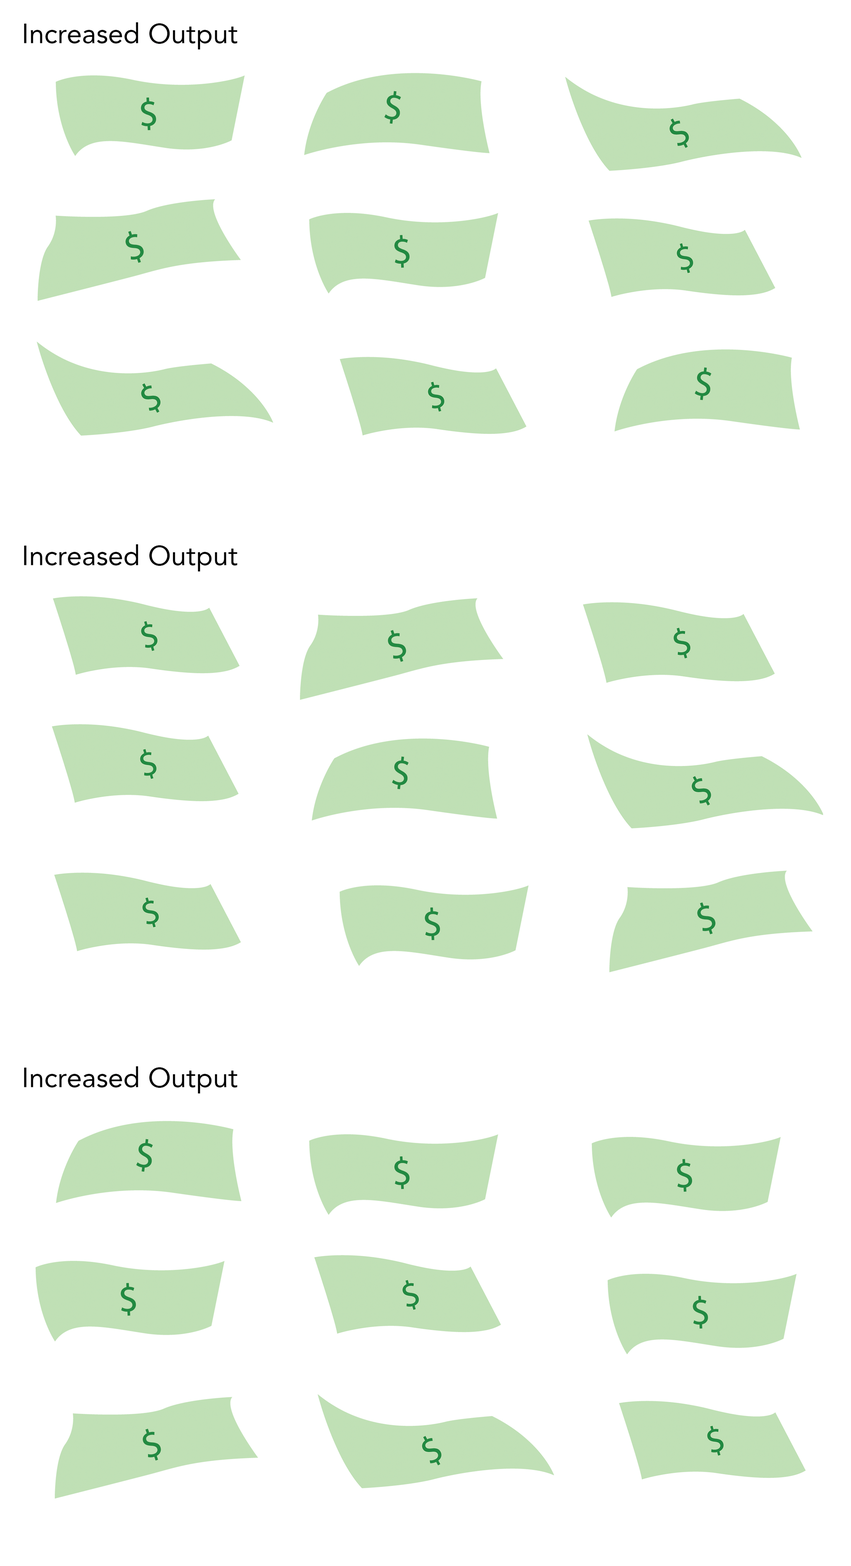
The macroeconomic effects of any economic activity can be calculated using economic multipliers that show the change in jobs or output that result from a change in final demand in any given industry. We estimate the impact of energy efficiency on output and employment by comparing the multipliers for the industries that are most impacted by the energy efficiency program to those that would have been affected in the absence of the program.
Environmental
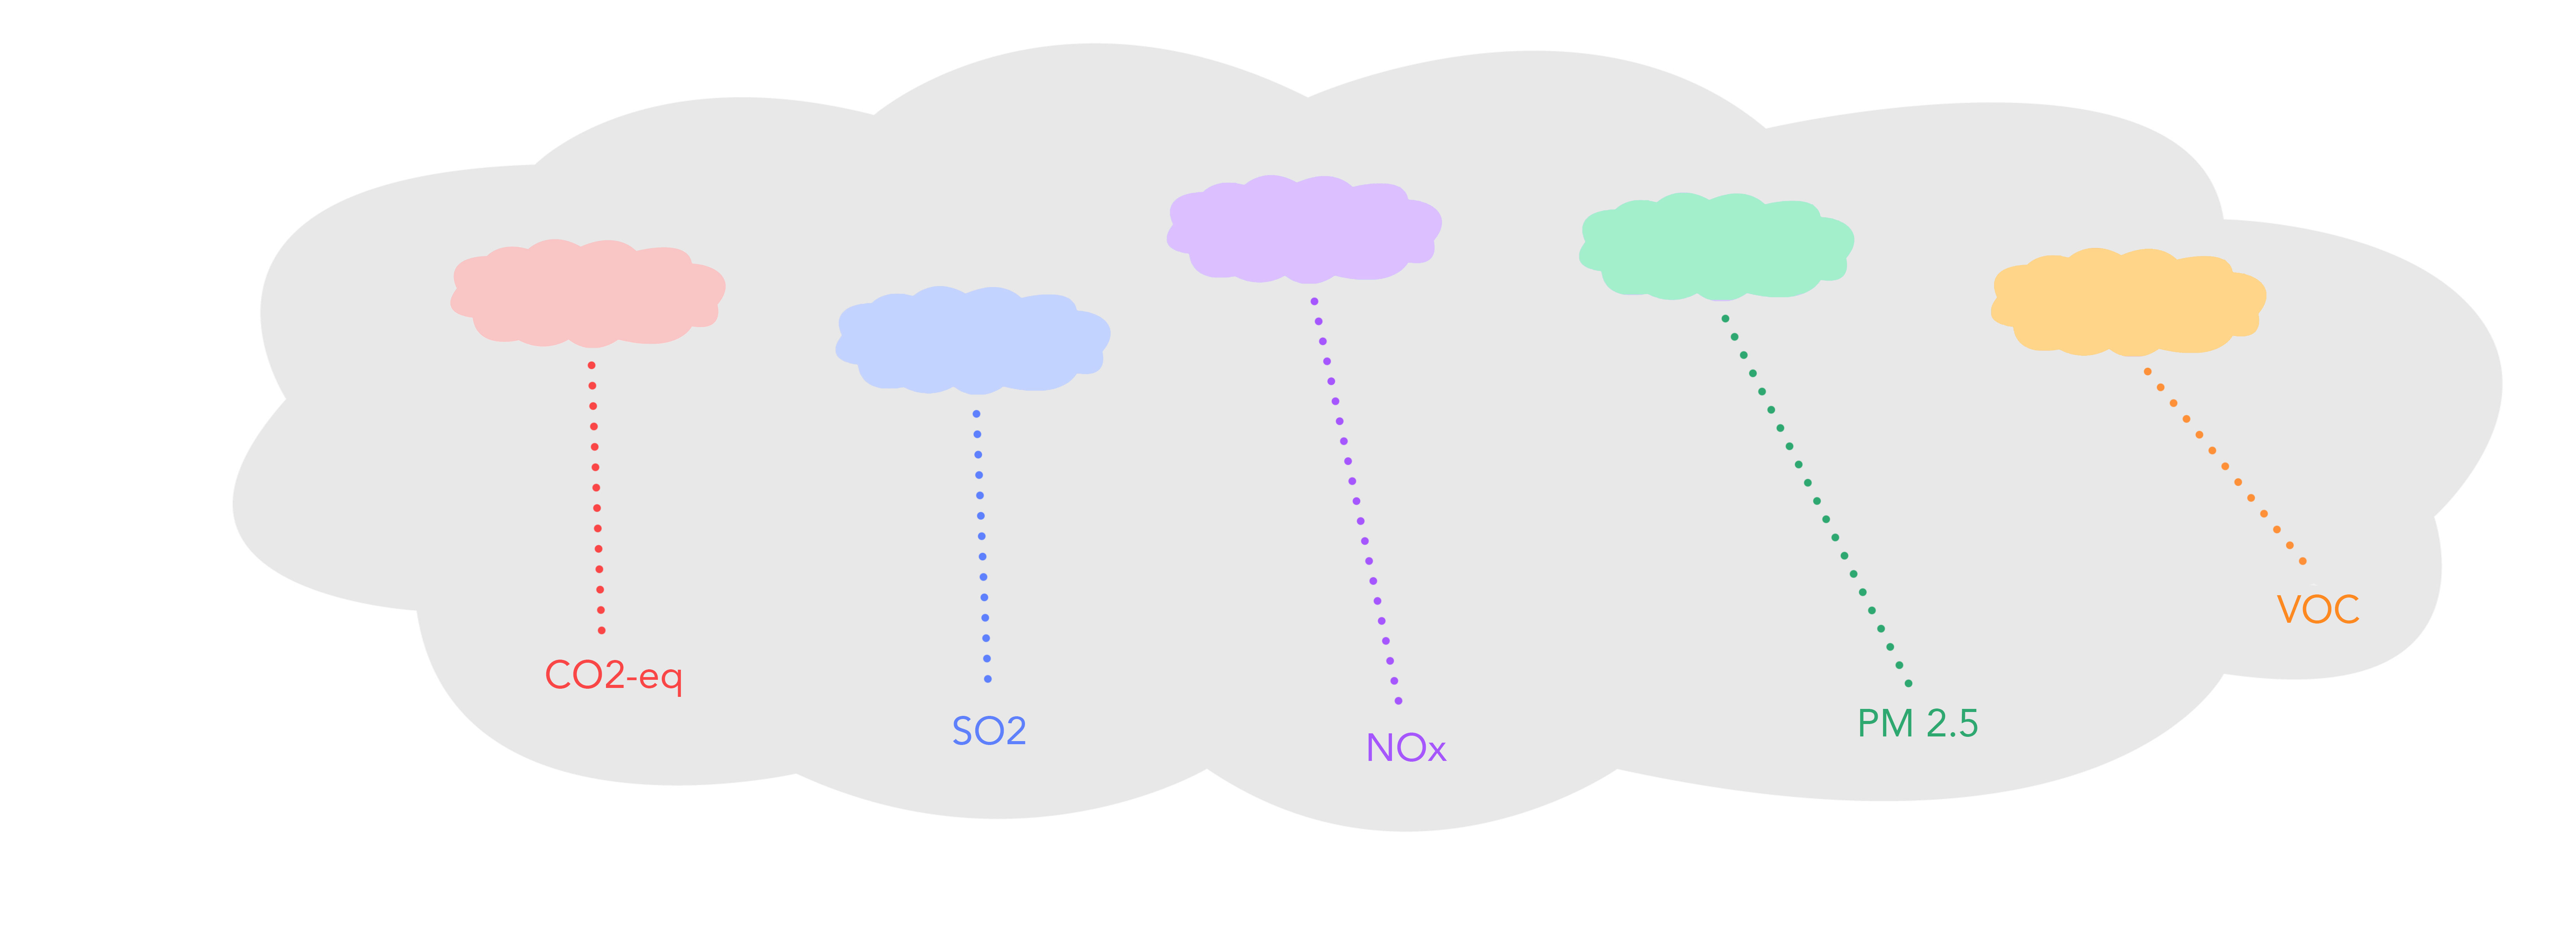
Environmental impacts result from energy efficiency programs, as the programs reduce energy usage and the negative environmental impacts that are associated with that usage. The major air pollutants associated with consumption of natural gas and electricity are the following.
- Greenhouse gases (represented in CO2-equivalent)
- Sulfur dioxide (SO2)
- Nitrogen oxide (NOx)
- Fine particulate matter less than 2.5 micrometers in diameter (PM 2.5)
- Volatile organic compounds (VOCs)
Our estimation of the environmental benefits typically involves three steps.
- Energy Usage Reductions by Fuel Type: Estimates of energy usage reductions from the program or measure are calculated for each fuel type from a recent impact analysis.
- Quantity of Avoided Emissions by Pollutant: Published data sources are used to estimate the emissions avoided as a result of energy usage reductions.
- Value of Avoided Emissions by Pollutant: The dollar value of avoided SO2, NOx, PM 2.5 and VOC emissions are computed using values estimated by the Office of Management and Budget (OMB) and Air Pollution Emission Experiments and Policy (APEEP) Model.
Improving Energy Affordability for Low-Income Households
Energy Affordability
Reducing energy usage can impact affordability for low-income households. Programs that reduce heating bills by 15% can reduce annual expenditures by a few hundred dollars per year. An example of such an impact is shown below.

Ratepayer Subsidy
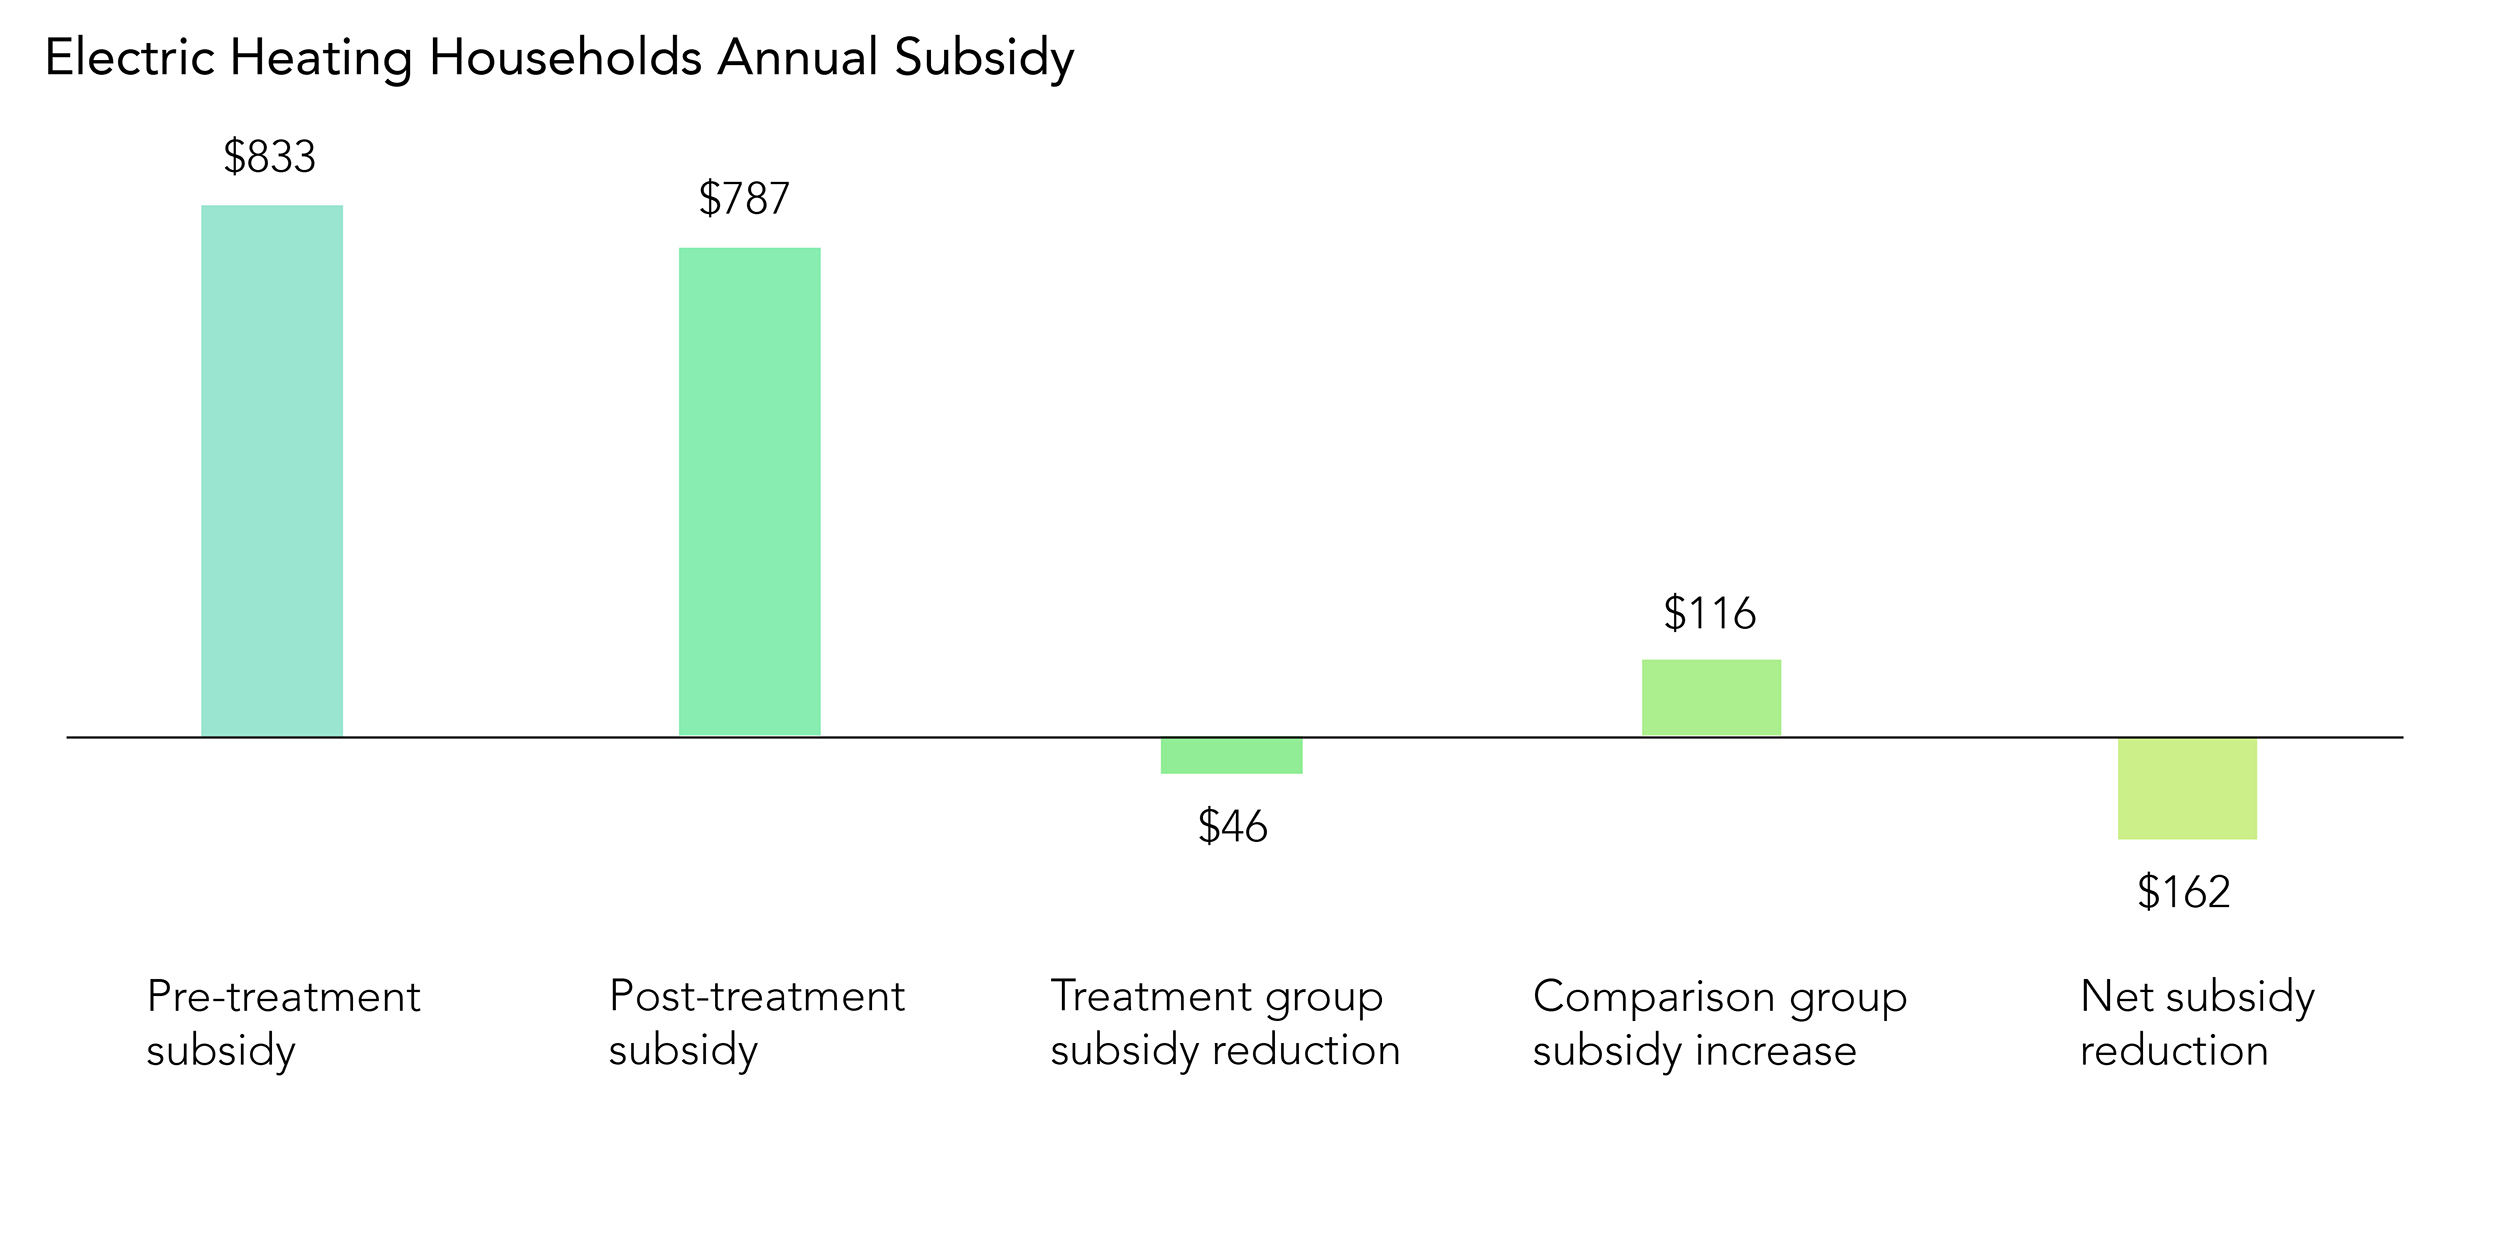
Some utilities provide bill payment assistance for low-income customers. Reducing the usage for these customers can reduce the cost borne by other ratepayers. An example of the impact in one program is shown to the right.
Performance Measurement
Performance Measurement Steps
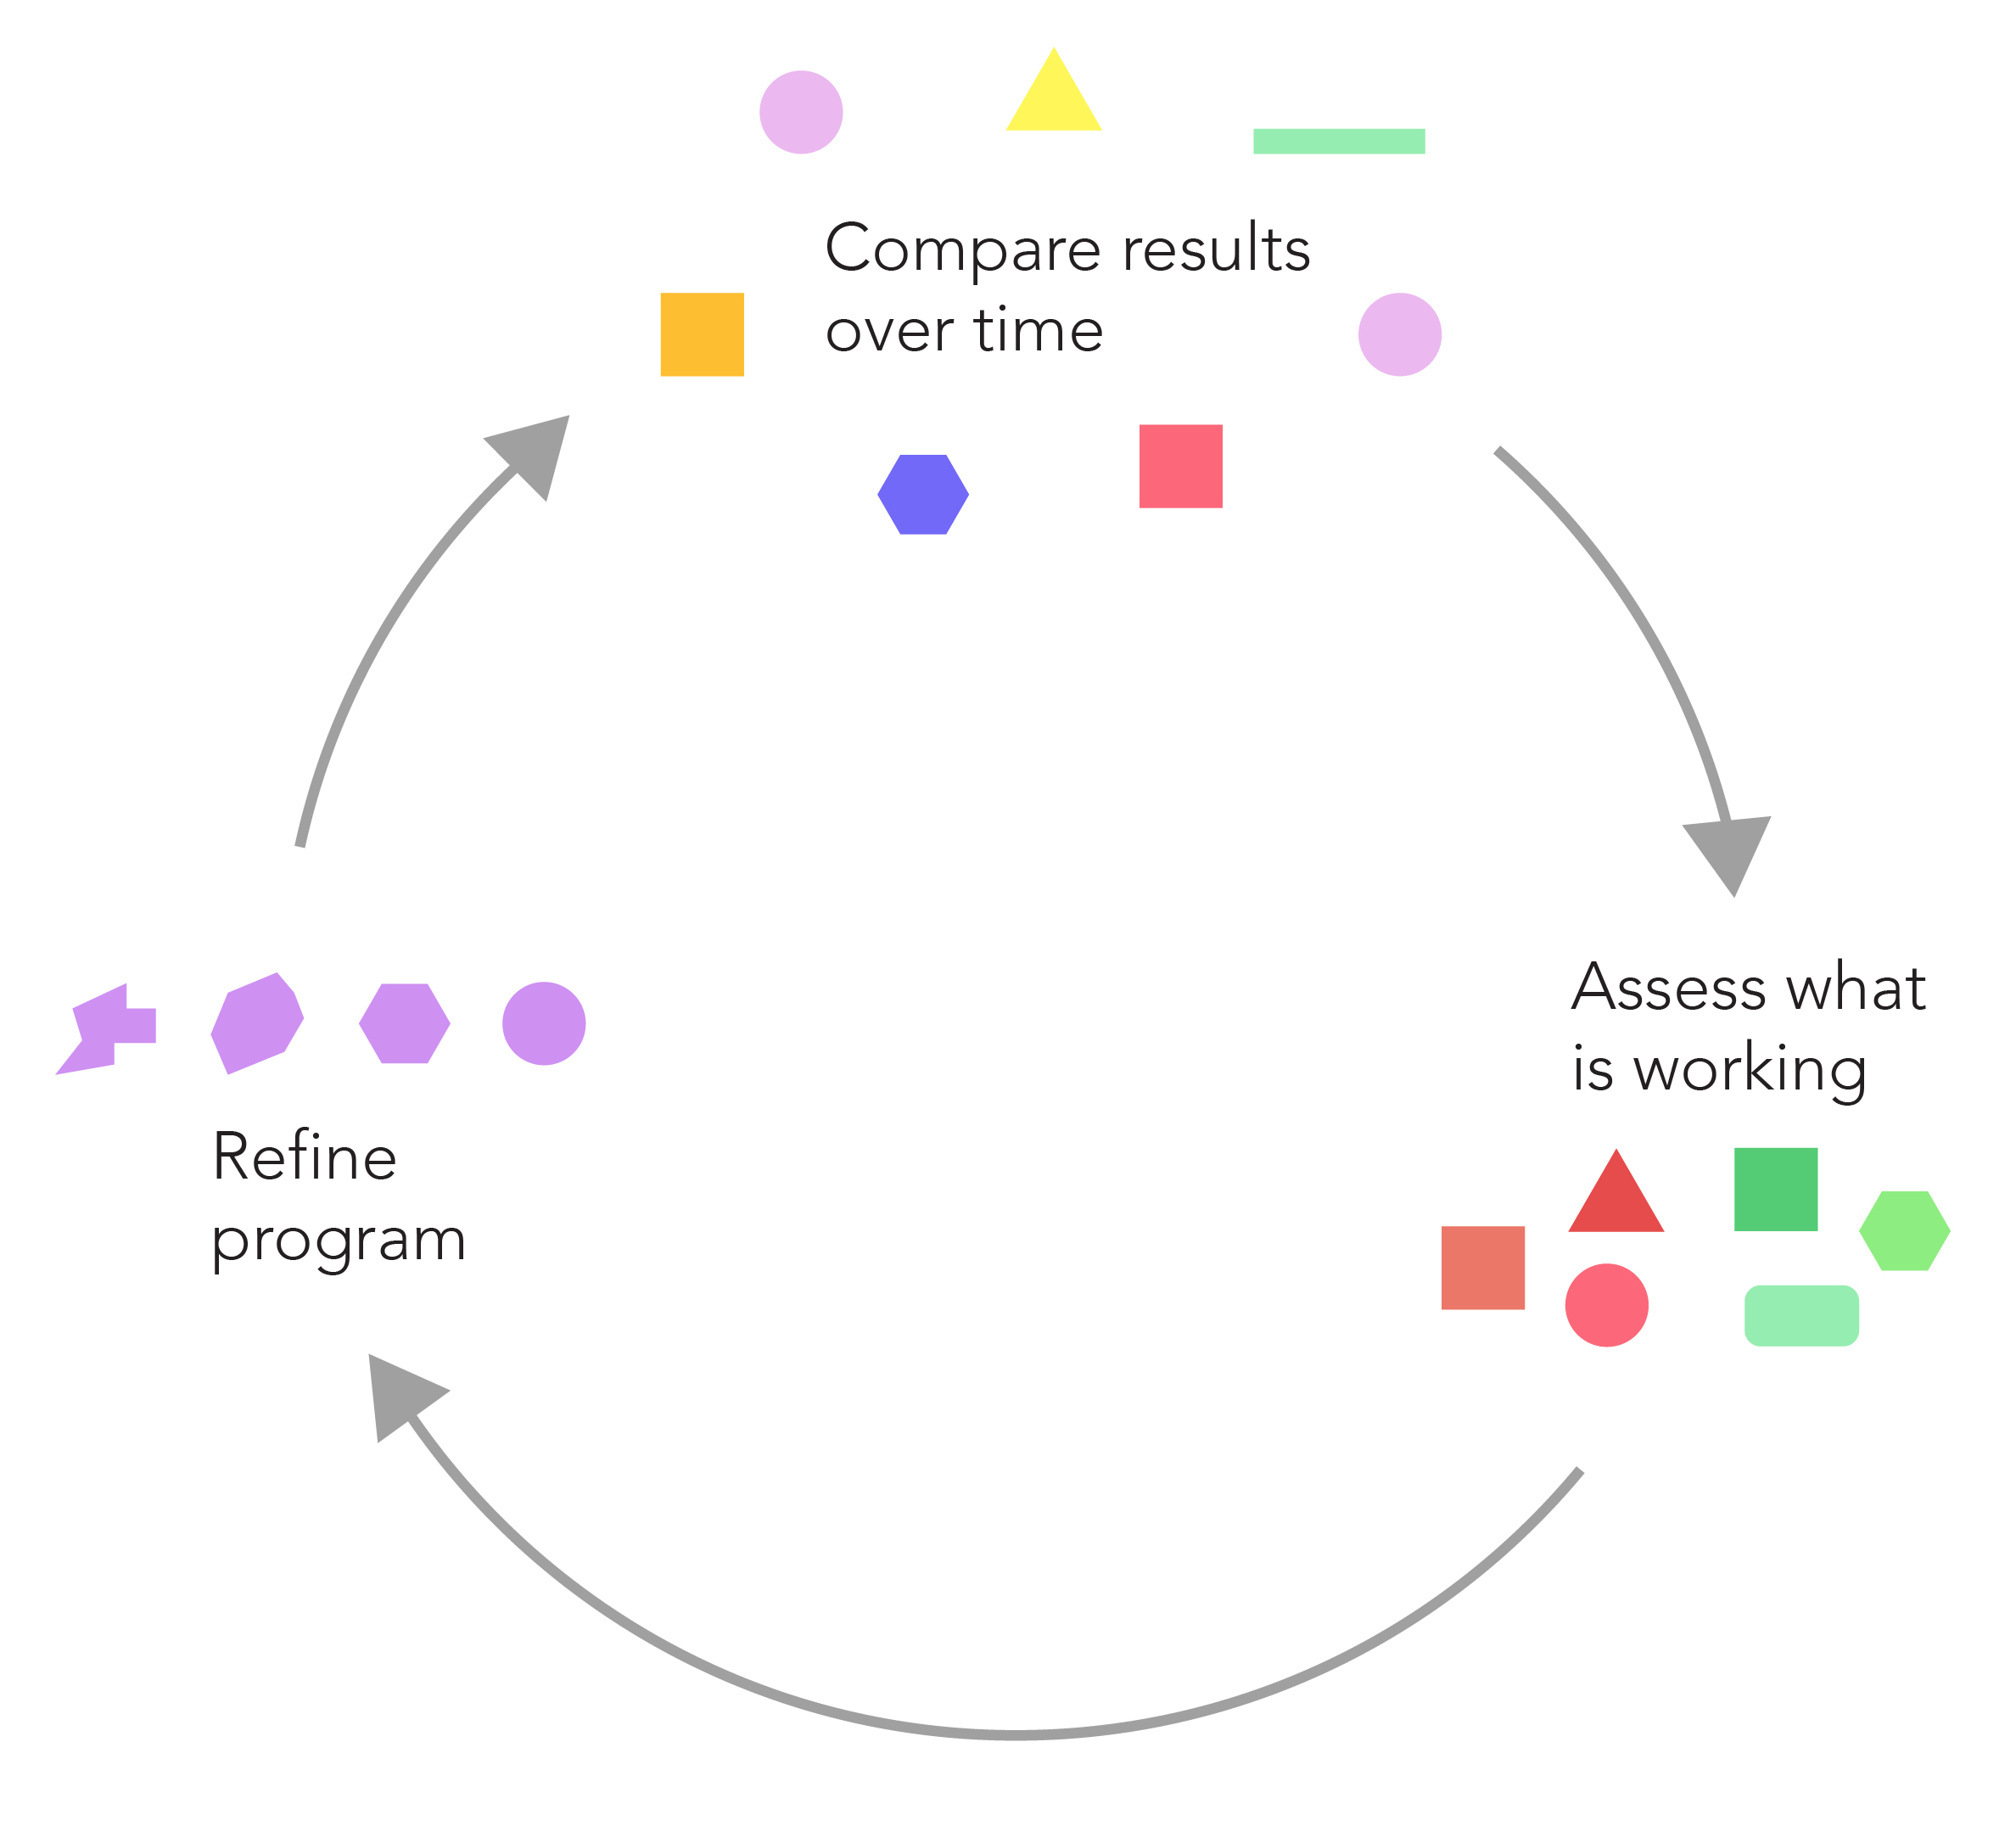
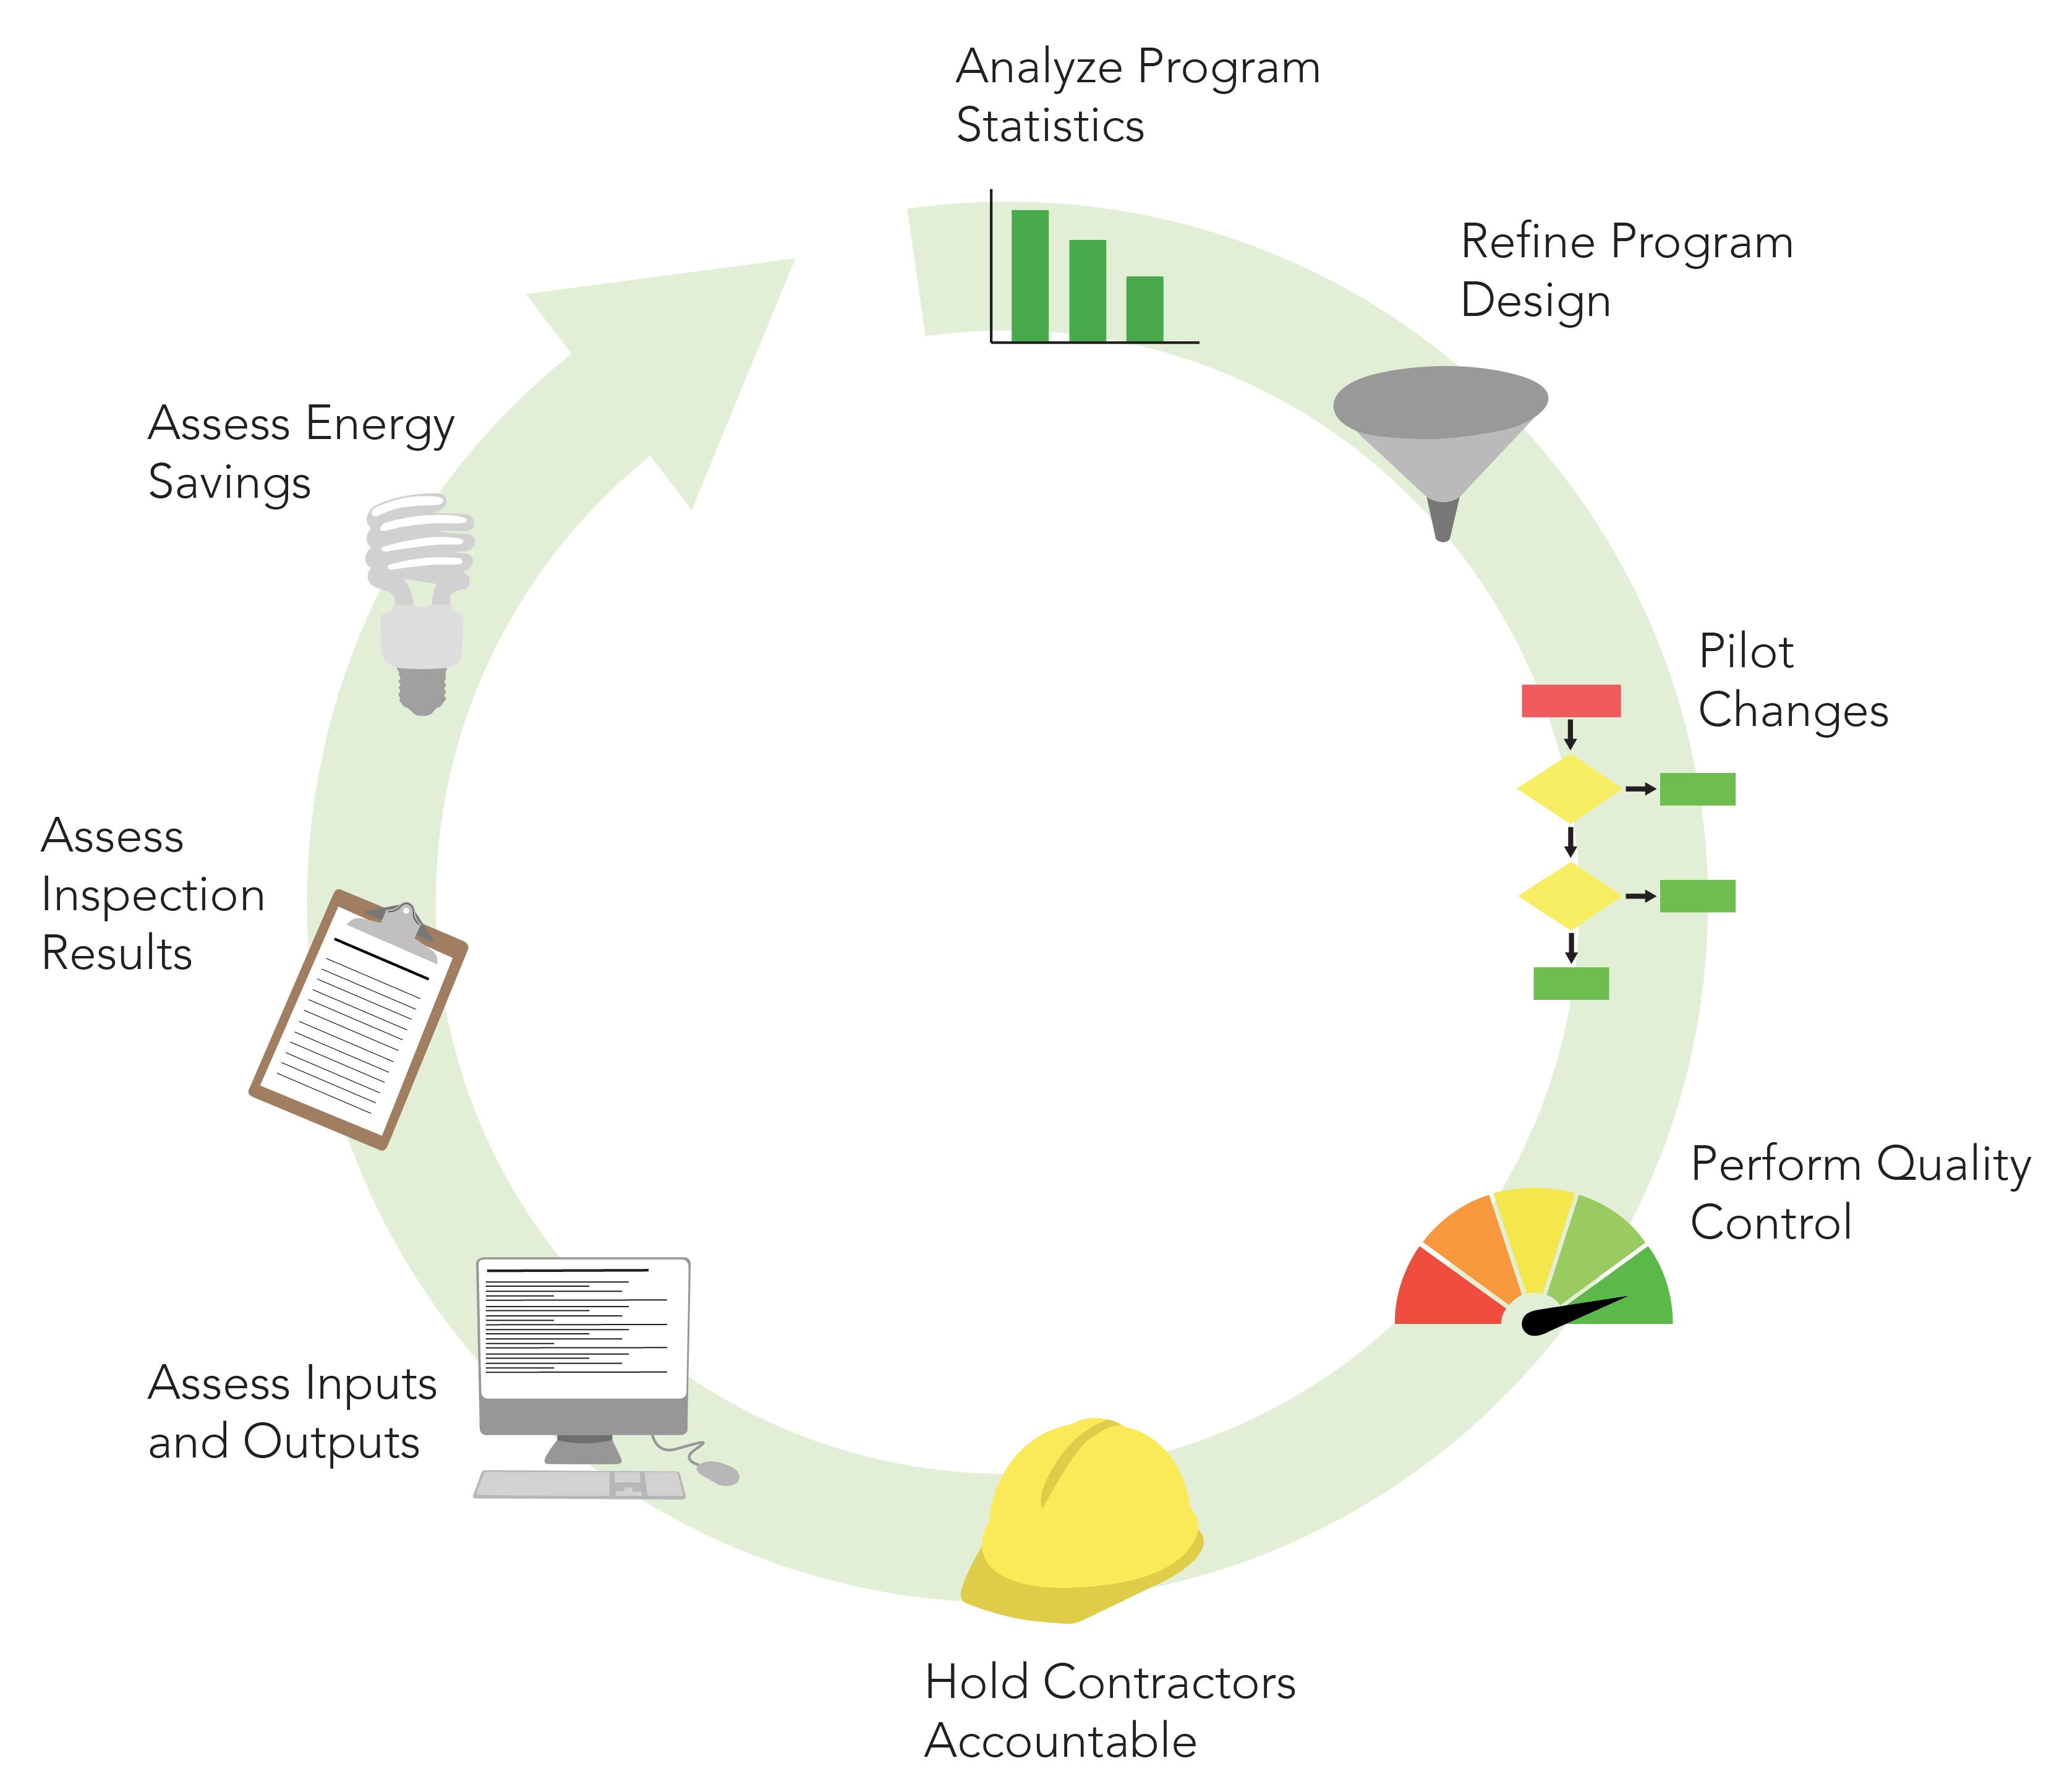
The figure to the right shows the steps that are included in the performance measurement approach.
- Step 1: Examine program statistics including pre-treatment usage distribution, major measure installation rates, and energy savings measured through a billing analysis.
- Step 2: Assess what refinements can improve those performance measures.
- Step 3: Pilot test some of those refinements on a limited basis.
- Step 4: Conduct quality control to ensure program is implemented as designed and that high quality work is performed.
- Step 5: Provide contractors with the training and tools that are needed and then hold contractors accountable for providing high-quality work.
- Step 6: Assess inputs (pre-treatment usage and measure spending) and outputs (measure installation rates) to see if program statistics have improved in a way that may lead to improved outcomes.
- Step 7: Conduct inspections and review results on rates of comprehensive installation, high-quality installation, missed opportunities, and poor work quality to see if performance has improved.
- Step 8: Assess energy savings through another billing analysis to see if program changes resulted in higher energy savings.
Assess Inputs and Outputs
This graph shows an example of improved inputs and outputs that may indicate improved energy savings will be found.
- Pre-Treatment Usage: In the baseline assessment, only 25% of participants had pre-treatment usage above 1,200 ccf. However, following additional targeting of high users, 35% of participants had pre-treatment usage above 1,200 ccf, and then additional outreach strategies were employed and 40% had pre-treatment usage above 1,200 ccf at the second follow-up assessment.
- Wall Insulation: In the baseline assessment, only 10% of participants had wall insulation installed. Following additional contractor training, 15% of participants had wall insulation installed. This percentage was subsequently increased to 25% after additional training and quality control.
- Other improvements are also shown in the graphic.

Assess Field Results
This graph shows an example of improved inspection results that may indicate improved energy savings will be found.
- Comprehensive Audit Diagnostics: The baseline audit review found that comprehensive audit diagnostics were only performed in 60% of the observations. After additional training and quality control, this percentage was increased to 75% in the first follow-up and then to 90% in the second follow-up.
- Major Air Sealing Addressed: The percentage of inspections that found all major air sealing opportunities were addressed was found to be 55% in the baseline review, 70% in the first follow-up, and 90% in the second follow-up.
- All of the improvements shown are expected to lead to higher energy savings.

Assess Energy Savings
Frequent billing analysis is needed to assess whether program refinements are leading to improved results.

Repeat
Performance Measurement is a cycle that needs to be repeated to ensure that results improve or that good results continue to be achieved.
